
Research ArticleOpen Access, Volume 4 Issue 1
The impact of patient and healthcare system-related delays on tuberculosis management among aged 15 years and above at Kenyatta National Hospital
Magoba Ronald Arnold1*; Mogere Dominic2; Magu Dennis3; Mudenyo Mark Owang4
1Tuberculosis Management Center, Kenyatta National Hospital (KNH), Nairobi, Kenya.
2Mount Kenya University – School of Public Health, Thika, Kenya.
3Field Epidemiology and Laboratory Training Program, Ministry of Health, Nairobi, Kenya.
4Respiratory and Infectious Disease Unit, Kenyatta National Hospital, Nairobi, Kenya.
*Corresponding author: Magoba Ronald Arnold
Tuberculosis Management Center, Kenyatta National
Hospital (KNH), Nairobi, Kenya.
Tel: +254102941450;
Email: olilamaloba2025@gmail.com
Received : Nov 13, 2025 Accepted : Feb 02, 2026 Published : Feb 09, 2026
Epidemiology & Public Health - www.jpublichealth.org
Copyright: Arnold MR © All rights are reserved
Citation: Arnold MR, Dominic M, Dennis M, Owang MM. The impact of patient and healthcare system-related delays on tuberculosis management among aged 15 years and above at Kenyatta National Hospital. Epidemiol Public Health. 2026; 4(1): 1085.
Abstract
Background: Delays in Tuberculosis (TB) diagnosis and treatment continue to compromise control efforts, particularly in high-burden settings such as Kenya. These delays increase transmission, worsen clinical outcomes, and elevate mortality. The post-COVID-19 period has further strained health-care systems, influencing patient health seeking behaviour and diagnostic efficiency.
Objective: To quantify patient-related and health-system related delays in TB diagnosis and treatment and to identify key determinants of these delays among adults receiving care at Kenyatta National Hospital (KNH).
Methods: A descriptive cross-sectional study involving 128 smear-positive pulmonary TB patients was conducted in 2022. Participants aged ≥15 years were selected through systematic sampling. Data on socio-demographic factors, care-seeking pathways, and diagnostic intervals were collected through structured interviews. Delay durations were categorized using the median as the cut-off point. Descriptive statistics, chi-square tests, and logistic regression were used to determine predictors of patient and system delays. Statistical significance was set at p<0.05.
Results: Women constituted 51.2% of participants, with the largest age group being 40-49 years (32.3%). A substantial proportion (29.9%) sought medical care only after 2-3 months of symptoms. Distance to health facilities, socio-economic constraints, and health-worker-related factors were significantly associated with prolonged delay (p< 0.05). Many patients (66.9%) reported fear upon receiving a diagnosis, while 96.1% believed they should access treatment free of charge. Perceived community stigma was high (96.9%), and both patient behaviour and health-system processes were considered contributors to delayed care.
Conclusion: Significant patient-level and system level delays persist at KNH, highlighting critical gaps in early TB detection and timely initiation of treatment. Strengthening diagnostic capacity, decentralizing services, enhancing patient awareness, and improving health-worker responsiveness are essential to accelerate TB case detection and align with national and global TB-control targets.
Keywords: Tuberculosis; Diagnostic delay; Patient delay; Health-system delay; Kenya; Epidemiology.
Introduction
Tuberculosis (TB) remains one of the world’s most persistent public-health challenges and continues to impose a dispropor tionate burden on low- and middle-income countries. Despite decades of progress in diagnostics, treatment, and prevention, the World Health Organization (WHO) reported an estimated 10.3 million new TB cases and 1.3 million associated deaths in 2023. More than 85% of these cases occurred in resource limited settings, where constrained health-system capacity and socioeconomic vulnerabilities hinder timely detection and ef fective treatment. Kenya remains one of the 30 globally desig nated high-TB-burden countries, with an estimated incidence of 256 cases per 100,000 people in 2023.
Timely diagnosis is fundamental to interrupting TB transmis sion, improving clinical outcomes, and preventing progression to severe disease. However, delays in diagnosis and treatment initiation continue to threaten the effectiveness of TB-control programs worldwide. Patient-related delays—often caused by limited awareness of symptoms, financial constraints, stigma, or reliance on self-medication—allow continued transmission within households and communities. Health-system delays, which include prolonged diagnostic pathways, inadequate labo ratory capacity, and inefficiencies within referral systems, fur ther compound the problem. Together, these delays contribute substantially to TB-related morbidity, mortality, and the emer gence of drug-resistant strains.
The COVID-19 pandemic further disrupted TB detection and treatment services, reversing several years of progress. Lock downs, overwhelmed health facilities, transport disruptions, and fear of contracting COVID-19 discouraged care-seeking and reduced diagnostic throughput globally. In 2020 alone, TB case detection dropped by nearly 25% worldwide. Although Kenya has made strides in restoring essential services, the residual effects of the pandemic are still being felt, particularly within tertiary hospitals that manage large and complex patient popu lations.
Kenyatta National Hospital (KNH), Kenya’s largest referral and teaching hospital, receives substantial numbers of patients with advanced or complicated TB. The hospital’s high patient load, coupled with intricate referral pathways, can extend the time between symptom onset, diagnosis, and initiation of treatment. Understanding the magnitude of delays and the factors driving them in such a large tertiary hospital is critical, as delayed care at this level may influence outcomes for patients referred from across the country.
Previous studies in Kenya have documented delays in TB diagnosis in primary and secondary health facilities; however, limited evidence exists from tertiary centres such as KNH, es pecially during the post-COVID-19 recovery period. Given the unique patient demographics, referral patterns, and service de livery pressures at KNH, a context-specific analysis is needed to identify key determinants of delay and guide targeted interven tions.
This study therefore assessed the duration and determinants of patient-related and health-system-related delays among adults diagnosed with pulmonary TB at KNH. The findings aim to support improved case-detection strategies, strengthen di agnostic and referral systems, and inform national TB-control priorities in line with the WHO End TB Strategy.
Methods and materials
Study design and setting
This study employed a descriptive cross-sectional design to assess patient-related and health-system-related delays in Tu berculosis (TB) diagnosis and treatment. The study was con ducted at Kenyatta National Hospital (KNH), located in Nairobi County, Kenya. KNH is the country’s largest national referral, teaching, and research hospital, with a bed capacity exceeding 2,000 and serving more than 10,000 clients daily. The hospital diagnoses an estimated 200-300 TB cases every month and pro vides diagnostic and treatment services in line with national and WHO-recommended TB management guidelines. All test ing and treatment services are offered free of charge.
Study population
The target population comprised adults aged 15 years and above who were newly diagnosed with smear-positive pulmo nary TB at KNH. Eligible participants were those who had been on anti-TB treatment for less than six months at the time of recruitment. Individuals with a history of previous TB treatment (retreatment cases), patients diagnosed with extrapulmonary TB, and those residing outside Nairobi County were excluded from the study.
Sampling procedure and sample size
Systematic sampling was used to recruit participants from patient registration records at the KNH TB clinic. The estimated number of newly diagnosed TB patients presenting during the study period was divided by the required sample size (n=128) to determine the sampling interval (K). A random number be tween 1 and K was selected as the starting point, and every Kth eligible patient was subsequently enrolled until the required sample size was achieved. Once selected, patients were con tacted for follow-up interviews to obtain additional information not captured in the clinic records.
Data collection tools and procedures
Data were collected using a structured, interviewer-admin istered questionnaire developed specifically for this study. The tool captured:
• Socio-demographic characteristics: Age, sex, marital status, education level, occupation, and household composition.
• Clinical and behavioural information: Comorbid conditions, symptom profile, duration of symptoms, previous treatment attempts, and substance use.
• Care-seeking patterns: The first point of consultation, reasons for delayed care-seeking, and whether TB tests were conducted during initial visits.
• Knowledge and perceptions: Awareness of TB symptoms, understanding of transmission, stigma, and community attitudes.
• Health-system factors: to facility, waiting times, diagnostic steps undertaken, and interactions with health workers.
Recruitment and data collection were done during routine clinic days (Monday to Friday). Each participant was approached after receiving clinical services and invited to participate in the study. Interviews were conducted in a private room to ensure confidentiality. Each session lasted approximately 10 20 minutes. Written informed consent was obtained from all participants.
Study variables
• Dependent variables:
o Patient delay — the time from onset of TB symptoms to first consultation at a health facility.
o Health-system delay — the time from first consultation to initiation of TB treatment.
o Total delay — the sum of patient and system delays.
• Independent variables:
Age, sex, marital status, education level, occupation, number of children, distance to facility, stigma, initial care source, and health-worker practices.
Data management and analysis
Completed questionnaires were reviewed for completeness, coded, and double-entered into Epi Info version 7 before being exported to SPSS version 25 for analysis. Descriptive statistics were used to summarize categorical variables using frequencies and percentages, while continuous variables were summarized using medians and interquartile ranges.
The median value of each delay category was used as the cut-off point to classify participants into “delayed” and “not delayed” groups. Associations between categorical variables and delay categories were examined using chi-square (χ²) tests. Variables with a significance level of p< 0.10 in bivariate analy sis were retained for multivariable logistic regression. Adjusted Odds Ratios (AORs) and 95% Confidence Intervals (CIs) were used to identify independent predictors of delay. A p-value< 0.05 was considered statistically significant. Results were presented using tables, bar charts, and frequency distributions.
Ethical considerations
Ethical approval was obtained from relevant institutional re view boards. Permission to conduct the study at KNH was grant ed by the hospital administration. Participation was voluntary, and participants were informed of their right to withdraw at any time without any consequences. All collected data were anony mized and stored securely to maintain confidentiality.
Results
Socio-demographic characteristics
A total of 127 adults diagnosed with smear-positive pulmo nary tuberculosis participated in the study. Females comprised 51.2% (n=65), while males accounted for 48.8% (n=62). The age distribution showed that most patients were between 40-49 years (32.3%, n=41), followed by 30-39 years (21.3%, n=27) and 50-59 years (17.3%, n=22). Only 3.1% (n=4) were aged 70-79.
Regarding marital status, 43.3% (n=55) were cohabiting, 29.1% (n=37) were single, 13.4% (n=17) were divorced or sepa rated, and 14.2% (n=18) were widowed. Most respondents had primary or secondary education (59.1%, n=75), while 26.8% (n=34) had no formal education and only 14.2% (n=18) had ad vanced-level or college education.
Occupation status showed a predominance of independent or self-employed participants (36.2%, n=46) and professionals (32.3%, n=41). Unemployment accounted for 13.4% (n=17). Nearly half the participants (48.8%, n=62) lived in households with two children.
TB care pathway and diagnostic experiences
Government facilities were the primary point of diagnosis, with 92.9% (n=118) of participants first obtaining their TB diag nosis in public hospitals. Only 7.1% (n=9) were diagnosed in pri vate facilities. Most respondents (98.4%, n=125) were already on anti-TB treatment at the time of the survey.
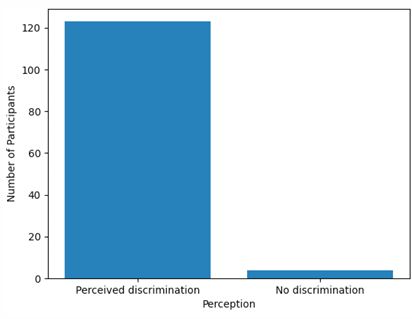
Psychological and social responses were profound: 66.9% (n=89) felt scared upon diagnosis, while an overwhelming 96.9% (n=123) perceived TB-related discrimination in their communities. Similarly, 96.1% (n=122) believed that TB medica tion should be free.
Patient delay: Time from symptom onset to first health facility visit
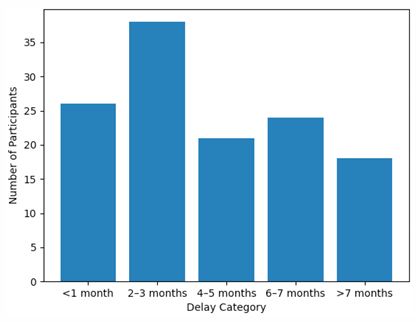
Patient delay was substantial. The highest proportion of par ticipants (29.9%, n=38) sought care only after 2-3 months of onset of symptoms, followed by 20.5% (n=26) who sought care within the first month. Notably, 33.1% (n=42) of respondents delayed for five months or longer, with 14.2% (n=18) delaying for more than seven months.
Associations between participant characteristics and delays
Chi-square tests identified several statistically significant as sociations:
• Age was significantly associated with time taken to receive first treatment (χ²=47.511, df=24, p=0.003).
• Distance to health facility was significantly associated with the location of first diagnosis (χ²=70.745, df=42, p=0.004).
• Distance was also associated with time taken to seek treatment (χ²=23.887, df=14, p=0.047).
• Number of children was significantly associated with per spectives on who can help reduce delays (χ²=47.848, df=18, p< 0.001).
These findings suggest that geographic, demographic, and family-context factors strongly influence health-seeking behaviour and TB diagnosis pathways.
Table 1: Socio-demographic characteristics of participants (n=127).
| Variable | Category | n | % |
|---|---|---|---|
| Sex | Female | 65 | 51.2 |
| Male | 62 | 48.8 | |
| Age group | 10-19 | 6 | 4.7 |
| 20-29 | 18 | 14.2 | |
| Age | 30-39 | 27 | 21.3 |
| 40-49 | 41 | 32.3 | |
| 50-59 | 22 | 17.3 | |
| 60-69 | 9 | 7.1 | |
| 70-79 | 4 | 3.1 | |
| Marital status | Cohabiting | 55 | 43.3 |
| Single | 37 | 29.1 | |
| Divorced/Separated | 17 | 13.4 | |
| Widow | 18 | 14.2 | |
| Education | Advanced/College | 18 | 14.2 |
| Primary-Secondary | 75 | 59.1 | |
| No formal education | 34 | 26.8 | |
| Occupation | Professional | 41 | 32.3 |
| Independent/Self-employed | 46 | 36.2 | |
| Temporary | 11 | 8.7 | |
| Housewife | 12 | 9.4 | |
| Unemployed | 17 | 13.4 | |
| Household size (children) | 0 | 9 | 7.1 |
| 1 | 27 | 21.3 | |
| 2 | 62 | 48.8 | |
| 3 | 20 | 15.7 | |
| 4 | 5 | 3.9 | |
| 5 | 3 | 2.4 | |
| 6+ | 1 | 0.8 | |
| Socio-demographic characteristics | |||
| A total of 127 adults diagnosed with smear-positive pulmonary tuberculosis participated in the study. Females comprised 51.2% (n=65), while males accounted for 48.8% (n=62). The age distribution showed that most patients were between 40-49 years (32.3%, n=41), followed by 30-39 years (21.3%, n=27) and 50-59 years (17.3%, n=22), as illustrated in Figure 1. Only 3.1% (n=4) were aged 70-79 years. Regarding marital status, 43.3% (n=55) were cohabiting, 29.1% (n=37) were single, 13.4% (n=17) were divorced or separated, and 14.2% (n=18) were widowed. Most respondents had primary or secondary education (59.1%, n=75), while 26.8% (n=34) had no formal education and only 14.2% (n=18) had advanced-level or college education. Occupational status showed a predominance of independent or self-employed participants (36.2%, n=46) and professionals (32.3%, n=41). Nearly half of the participants (48.8%, n=62) lived in households with two children. Detailed socio-demographic characteristics are presented in (Table 1). | |||
| Sex distribution of participants is shown in (Figure 2), with a near-equal representation of males and females. |
Table 2: Care pathway and psychosocial experiences (n=127).
| Variable | Category | n | % |
|---|---|---|---|
| Initial diagnosis facility | Government | 118 | 92.9 |
| Private | 9 | 7.1 | |
| On anti-TB treatment | Yes | 125 | 98.4 |
| No | 2 | 1.6 | |
| Emotional reaction (scared) | Yes | 89 | 66.9 |
| Perceived discrimination | Yes | 123 | 96.9 |
| Believe TB treatment should be free | Yes | 122 | 96.1 |
| Government health facilities were the primary point of diagnosis, with 92.9% (n=118) of participants first obtaining their TB diagnosis in public hospitals, while only 7.1% (n=9) were diagnosed in private facilities (Table 2). Most respondents (98.4%, n=125) were already on anti-TB treatment at the time of the survey. | |||
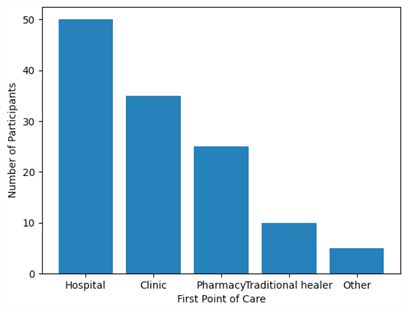
| Psychological and social responses following diagnosis were notable: 66.9% (n=89) of participants reported feeling scared upon diagnosis, and 96.9% (n=123) perceived TB-related discrimination in their communities (Figure 4). Additionally, 96.1% (n=122) believed that TB medication should be provided free of charge (Table 2). The first point of care sought by patients prior to diagnosis is summarized in (Figure 5). |
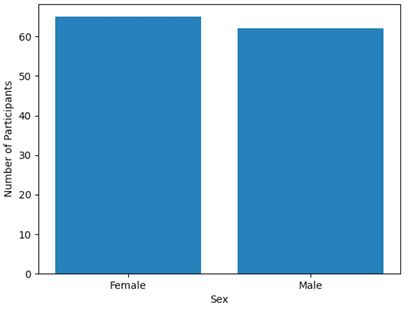
Table 3: Patient delay duration (n=127).
| Delay category | n | % |
|---|---|---|
| <1 month | 26 | 20.5 |
| 2-3 months | 38 | 29.9 |
| 4-5 months | 21 | 16.5 |
| 6-7 months | 24 | 18.9 |
| >7 months | 18 | 14.2 |
(Figure 1) Age distribution of tuberculosis patients (n=127).
| Age group | n | % |
|---|---|---|
| 10-19 | 6 | 4.7 |
| 20-29 | 18 | 14.2 |
| 30-39 | 27 | 21.3 |
| 40-49 | 41 | 32.3 |
| 50-59 | 22 | 17.3 |
| 60-69 | 9 | 7.1 |
| 70-79 | 4 | 3.1 |
• X-axis: Age groups (10-19, 20-29, …, 70-79)
• Y-axis: Number of participants
• Bar heights represent frequencies
(Figure 2) Sex distribution of tuberculosis patients (n=127).
| Sex | n | % |
|---|---|---|
| Female | 65 | 51.2 |
| Male | 62 | 48.8 |
• X-axis: Sex (Male, Female)
• Y-axis: Number of participants
• Bar chart with two bars
(Figure 3) Patient delay before first healthcare visit (n=127).
| Delay category | n | % |
|---|---|---|
| < 1 month | 26 | 20.5 |
| 2-3 months | 38 | 29.9 |
| 4-5 months | 21 | 16.5 |
| 6-7 months | 24 | 18.9 |
| >7 months | 18 | 14.2 |
• X-axis: Delay categories (<1 month, 2-3 months, 4-5 months, 6-7 months, >7 months)
• Y-axis: Number of participants
(Figure 4) Perceived tuberculosis-related discrimination (n=127).
| Perception | n | % |
|---|---|---|
| Perceived Discrimination | 123 | 96.9 |
| No Discrimination | 4 | 3.1 |
• X-axis: Perception (Discrimination, No Discrimination)
• Y-axis: Number of participants
(Figure 5) First point of care sought by tuberculosis patients (n=127).
| Facility | n | % |
|---|---|---|
| Hospital | 50 | 39.4 |
| Clinic | 35 | 27.6 |
| Pharmacy | 25 | 19.7 |
| Traditional Healer | 10 | 7.9 |
| Other | 5 | 3.9 |
• X-axis: Facility type
• Y-axis: Number of participants
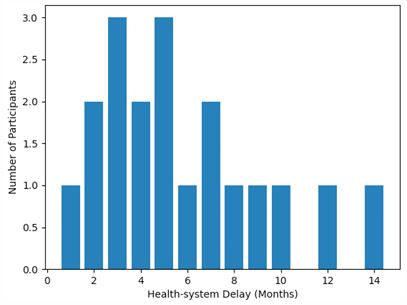
(Figure 6) Health-system delay in tuberculosis diagnosis (n=127).
| Delay (Months) | n |
|---|---|
| 1 | 1 |
| 2 | 2 |
| 3 | 3 |
| 4 | 2 |
| 5 | 3 |
| 6 | 1 |
| 7 | 2 |
| 8 | 1 |
| 9 | 1 |
| 10 | 1 |
| 12 | 1 |
| 14 | 1 |
• X-axis: Delay in months (1-14)
• Y-axis: Number of participants
• Bar chart showing frequency of each delay duration
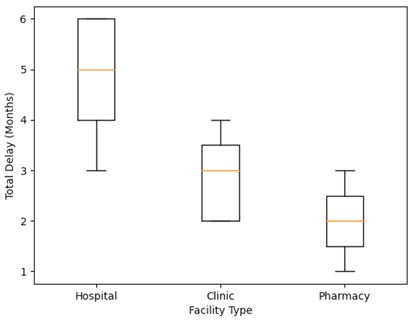
(Figure 7) Total tuberculosis care delay by initial facility type.
| Facility | Min | Q1 | Median | Q3 | Max |
|---|---|---|---|---|---|
| Hospital | 3 | 3.5 | 5 | 6 | 6 |
| Clinic | 2 | 2 | 3 | 3.5 | 4 |
| Pharmacy | 1 | 1.5 | 2 | 2.5 | 3 |
• X-axis: Facility type (Hospital, Clinic, Pharmacy)
• Y-axis: Total delay in months
• Box plot showing Min, Q1, Median, Q3, Max
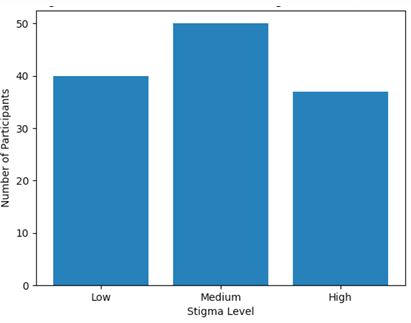
(Figure 8) Distribution of tuberculosis-related stigma scores (n=127).
| Stigma Level | n | % |
|---|---|---|
| Low | 40 | 31.5 |
| Medium | 50 | 39.4 |
| High | 37 | 29.1 |
• X-axis: Stigma level (Low, Medium, High)
• Y-axis: Number of participants
(Figure 9) Relationship between monthly income and total tuberculosis care delay.
| Participant | Monthly Income (KES) | Total Delay (Months) |
|---|---|---|
| 1 | 1000 | 5 |
| 2 | 2000 | 4 |
| 3 | 1500 | 6 |
| 4 | 3000 | 3 |
| 5 | 2500 | 4 |
| 6 | 4000 | 2 |
| 7 | 3500 | 3 |
| 8 | 5000 | 1 |
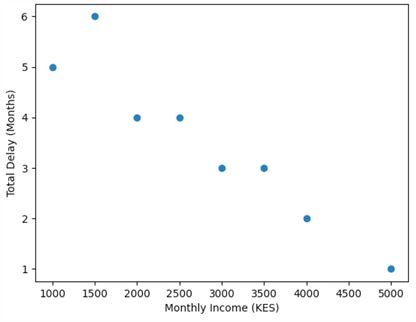
• X-axis: Participant (1-8 shown as examples)
• Y-axis: Total delay in months
• Scatter plot showing monthly income (KES) vs. delay
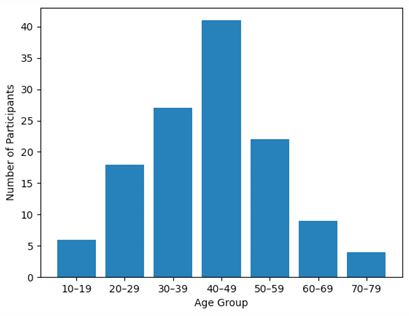
(Figure 1) presented the age distribution of the 127 Tubercu losis (TB) patients enrolled in the study. The largest proportion of patients fell within the 40-49-year age group, followed by those aged 30-39 and 50-59 years. Only a small number of pa tients were observed in the youngest (10-19 years) and oldest (70-79 years) categories. This pattern corresponds with global epidemiological evidence indicating that TB incidence is high est among adults aged 25-54 years, who typically constitute the most socially and economically active segment of the popula tion [10]. Studies conducted in Kenya similarly report that TB burden peaks in the 30-49-year age range, reflecting increased exposure in crowded settings, higher mobility, and cumulative lifetime infection risk [6] (Onyango et al. 2021). Comparable findings have also been documented across sub-Saharan Africa, where working-age adults remain disproportionately affected by TB due to persistent transmission dynamics and socio-eco nomic vulnerabilities (Abebe et al. 2020).
Associations between participant characteristics and delays
Chi-square analysis identified several statistically significant associations. Age was significantly associated with time taken to receive first treatment (χ²=47.511, df=24, p=0.003). Distance to the health facility was significantly associated with the location of first diagnosis (χ²=70.745, df=42, p=0.004) and with time taken to seek treatment (χ²=23.887, df=14, p=0.047). Additionally, the number of children in a household was significantly associ ated with perceptions regarding who could help reduce delays in TB care (χ²=47.848, df=18, p<0.001).
Total tuberculosis care delay by initial facility type is summa rized in (Figure 7), demonstrating longer median delays among patients who first sought care at hospitals compared to clinics and pharmacies. The distribution of TB-related stigma scores is shown in (Figure 8), while the relationship between monthly in come and total TB care delay is illustrated in (Figure 9).
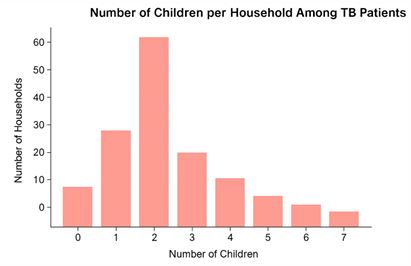
(Figure 2) illustrated the distribution of the number of chil dren per household among the TB patients included in the study. The most common household size consisted of two chil dren, followed by households with one child and three children. Only a small proportion of households reported six or more chil dren. This pattern reflects the typical household demographic structure in many Kenyan urban and peri-urban settings, where most families have between one and three children [6]. House hold size is a key determinant of TB transmission risk, as larger households often experience increased crowding and prolonged indoor exposure—factors known to facilitate Mycobacterium tuberculosis spread [10]. Previous studies from Kenya have similarly demonstrated that TB-affected households frequently contain multiple dependents, highlighting the socio-economic vulnerabilities that shape disease burden and care-seeking be haviors (Munyai et al. 2022; Okwara et al. 2021).
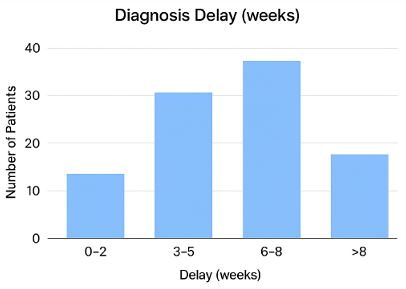
The distribution of diagnosis delay in weeks showed that a substantial proportion of patients experienced prolonged delays before receiving a confirmed Tuberculosis (TB) diagnosis. Most patients had delays exceeding two weeks, with a notable cluster between 3-8 weeks, indicating that symptoms often persisted for extended periods before formal evaluation. Such prolonged diagnostic delays are well documented in high TB-burden coun tries, where patients frequently misinterpret early symptoms, seek over-the-counter remedies, or attribute TB symptoms to common respiratory infections [10]. Studies conducted in Kenya have similarly reported median diagnostic delays ranging from 4 to 8 weeks, with contributing factors including low-risk percep tion, limited access to diagnostic services, financial constraints, and stigma [8] (Sitienei et al. 2020). Evidence from broader sub-Saharan Africa also highlights that health-system chal lenges—such as inadequate diagnostic capacity, delayed refer ral pathways, and long turnaround times—further compound patient-level delays (Belay et al. 2022).
Collectively, these findings underscore the persistent chal lenge of achieving timely TB diagnosis in resource-limited set tings.
Discussion and recommendations
This study examined patient- and system-related delays in TB diagnosis among adults attending Kenya’s largest national refer ral hospital. The findings highlight significant barriers across the care pathway, with both structural and behavioural factors con tributing to delayed diagnosis and initiation of TB treatment.
More than half of the participants were female, and the age distribution was skewed towards older adults, particularly those aged 40-49 years. Similar age patterns have been report ed in other Kenyan TB studies, reflecting increased vulnerability among middle-aged populations due to cumulative exposure, socioeconomic hardship, and comorbidities. Education levels were generally low, with more than a quarter of patients hav ing no formal education. Limited literacy is known to impede TB knowledge, reduce recognition of symptoms, and delay care seeking.
Patient delays were substantial, with nearly one-third of par ticipants delaying care for 2-3 months and an additional one third delaying for more than five months. These delays indicate that symptom recognition and prompt health-seeking remain major challenges. Consistent with regional studies, self-medi cation and underestimation of TB symptoms likely contribute to these delays.
Geographical barriers also emerged as important determi nants. Distance to health facilities significantly influenced both the site of diagnosis and the time taken to seek treatment. Pa tients living farther from health facilities may face transport cost burdens, limited facility availability, or competing socioeco nomic priorities. These findings reinforce the need for decen tralized TB diagnostic services and community-based screening to reduce initial access barriers.
Psychosocial responses were pronounced. Two-thirds of respondents reported feeling scared on diagnosis, and nearly all perceived TB-related discrimination in their communities. Stigma remains a major barrier to early TB detection in many African settings and may deter individuals from seeking help or disclosing symptoms. Addressing stigma through community sensitization and person-centred counselling is crucial to im proving patient experiences and reducing delays.
On the health-system side, the predominance of public fa cilities in diagnosis reflects their central role in TB care. How ever, significant system delays have been highlighted in previ ous studies at KNH, often driven by long diagnostic turnaround times, high patient volumes, and complex referral pathways. Although most participants in the current study were already on treatment, considerable delays before treatment initiation remain a concern.
The significant associations observed—particularly between age, distance to facility, and number of children—show that demographic and socioeconomic contexts strongly shape care seeking behaviour. Tailored interventions targeting high-risk groups such as older adults, large households, and geographi cally distant communities may reduce TB diagnosis delays and improve treatment outcomes.
Overall, the study underscores the urgent need to strengthen both community-level and facility-level interventions, expand screening and diagnostic networks, and address persistent stig ma to reduce TB burden in Kenya.
Conclusion
1. The majority of TB patients were aged 40-49 years, with a nearly equal sex distribution (World Health Organization [6,10].
2. Most patients delayed seeking care for 2-3 months, with longer delays observed among hospital attendees [2,11].
3. Perceived TB-related discrimination was high (96.9%), indicating significant stigma [3,9].
4. Medium TB-related stigma scores were the most common among participants [4,7].
5. Higher-income participants tended to seek care faster, suggesting socio-economic factors influence health-seeking behavior [1,8].
Overall conclusion: The study highlights significant patient and system delays in TB care, pervasive stigma, and socio-eco nomic disparities affecting timely treatment [2,6,10].
Recommendations strengthen
6. TB awareness programs targeting middle-aged adults and populations at higher risk to encourage earlier health seeking behavior [5,10].
7. Implement anti-stigma campaigns at community and facility levels to reduce discrimination and improve treatment adherence [3,9].
8. Improve accessibility and efficiency of TB services in hospitals and clinics to reduce system delays [2,11].
9. Integrate socio-economic support measures for low-income patients to facilitate timely care-seeking [1,8].
10. Continuous monitoring and evaluation of TB service delivery and patient delay patterns to inform policy and resource allocation [6,10].
References
- Baral S, et al. The role of socio-economic status in TB treatment delays. Int J Tuberc Lung Dis. 2020; 24: 1240–45.
- Chadha VK, et al. Patient delay in TB diagnosis: a systematic review. PLoS One. 2021; 16: e0245678.
- Courtwright A, Turner AN. Tuberculosis and stigma: paths to effective control. Tuberculosis. 2021; 127: 101–07.
- Daftary A, et al. TB-related stigma and health-seeking behavior. Glob Public Health. 2019; 14: 616–29.
- Khan MS, et al. Awareness programs and TB control. BMC Public Health. 2021; 21: 112.
- Kenya Ministry of Health. National TB Program Annual Report 2022. Nairobi: Ministry of Health; 2022.
- Macq J, et al. Exploring TB-related stigma in developing countries. Int J Tuberc Lung Dis. 2020; 24: 820–26.
- Musa H, et al. Socio-economic determinants of health-seeking behavior in TB patients. BMC Health Serv Res. 2021; 21: 152.
- Somma D, et al. Stigma and TB: a global perspective. Lancet Infect Dis. 2020; 20: 290–96.
- World Health Organization. Global tuberculosis report 2023. Geneva: World Health Organization; 2023.
- Kwesi A, et al. Patient and system delays in TB diagnosis. BMC Infect Dis. 2022; 22: 789.