
Research ArticleOpen Access, Volume 4 Issue 1
A Bio-Digital Twin framework for forecasting RSV transmission through integration of viral molecular stability, environmental microclimates, and population vulnerability across California
Rolando Mantilla*
Environmental Systems Research Institute/ Population Health, Healthpact LLC, USA.
*Corresponding author: Rolando Mantilla
Environmental Systems Research Institute/ Population Health, Healthpact LLC, USA.
Email: rmantilla@esri.com
Received : Jan 17, 2026 Accepted : Feb 13, 2026 Published : Feb 20, 2026
Epidemiology & Public Health - www.jpublichealth.org
Copyright: Mantilla R © All rights are reserved
Citation: Mantilla R. A Bio-Digital Twin framework for forecasting RSV transmission through integration of viral molecular stability, environmental microclimates, and population vulnerability across California. Epidemiol Public Health. 2026; 4(1): 1089.
Abstract
Respiratory Syncytial Virus (RSV) is a leading cause of pediatric and geriatric hospitalizations, with significant burden documented in both young children [10] and older adults [7]. Traditional forecasting models often rely on historical case trajectories and treat viral phenotypes as static, overlooking the dynamic nature of viral evolution (Babanejaddehaki et al. 2025). To address this limitation, we introduce a Bio-Digital Twin (Laubenbacher et al. 2021)— a multi-scale computational framework that integrates viral thermodynamic stability, simulated environmental microclimates, and demographic vulnerability to forecast RSV transmission dynamics (R₀) and hospitalization burden across 55 California cities for the 2026-2027 season. The model incorporates county-level smoking prevalence and vaccination coverage to refine population susceptibility estimates. Using a Random Forest regression algorithm [3] trained on a physics-informed synthetic dataset, our analysis identifies the California Deserts as a high-risk corridor. These findings suggest that outbreak severity may be driven more by deterministic viral-environmental interactions than by stochastic variation, underscoring the importance of incorporating biological and environmental dynamics into predictive models for respiratory disease planning.
Introduction
Background and significance
Respiratory Syncytial Virus (RSV) is a globally prevalent respi ratory pathogen that causes severe lower respiratory tract in fections, particularly in infants and in older adults [7,10,18]. RSV epidemics follow seasonal patterns, but their intensity can vary widely across regions and years, complicating outbreak predic tion and healthcare resource planning. Most existing RSV fore casting models are purely statistical, relying on historical case data or climate correlations (e.g., ARIMA time-series or regres sion-based approaches). These methods capture broad season al trends but often fail to resolve local variations and cannot anticipate abrupt changes driven by viral evolution (Babanejad dehaki et al. 2025). Consequently, critical virological factors are frequently overlooked in current prediction frameworks.
One such factor is the RSV Fusion (F) protein – a class I vi ral fusion glycoprotein essential for viral entry – whose confor mation and thermal stability significantly influence the virus’s environmental persistence and host cell entry efficiency [15]. Laboratory studies have shown that RSV variants with increased F-protein stability retain infectivity far longer under low-tem perature conditions, directly linking molecular changes to al tered epidemiological behavior [1]. Yet few forecasting efforts incorporate such molecular biophysics into their models. Bridg ing this gap by integrating viral evolutionary traits (like F-protein stability) into predictive models may enhance our ability to an ticipate RSV outbreak dynamics more accurately.
Conceptual framework: The Bio-digital twin
1. Biological agent: The molecular stability and hydrophobicity of the RSV Fusion (F) protein influence viral decay rates and transmission efficiency. Variants with enhanced F-protein stability exhibit prolonged infectivity under low-temperature conditions, suggesting that biophysical properties directly af fect environmental persistence and host-cell entry [1,15].
2. Environmental host: Microclimatic factors—such as temper ature, humidity, and surface exposure—modulate viral sur vival and influence human behavior, including indoor crowd ing and mobility patterns, which in turn affect transmission dynamics [18] (Babanejaddehaki et al. 2025).
3. Demographic host: Population-level susceptibility is shaped by age distribution, vaccination coverage, smoking preva lence, comorbidities, and healthcare access. These factors determine both infection risk and hospitalization burden, particularly among infants and older adults [7,10,19].
To operationalize this hypothesis, we developed a Bio-Digital Twin—a multi-scale computational replica of California’s re spiratory landscape. This framework integrates viral biophys ics, environmental simulations, and demographic vulnerability metrics to forecast RSV transmission and healthcare burden. By linking molecular mechanisms to population-level outcomes, the Bio-Digital Twin enables mechanistically informed predic tions of outbreak severity and resource demand.
Methods
Overview of data architecture
Our analytic pipeline integrates three primary data do mains—biological, environmental, and demographic—each contributing mechanistic covariates to the RSV forecasting model.
Biological domain: RSV fusion protein analysis
Amino acid sequences of the RSV Fusion (F) protein were re trieved from the NCBI Protein Database using Biopython [4]. For each viral strain, we computed:
• Instability index: A proxy for thermodynamic stability and degradation rate [9].
• GRAVY (Grand Average of Hydropathy): A measure of hy drophobicity and membrane association potential [13].
• Aromaticity and predicted disorder: Used in secondary analyses to assess structural flexibility and antigenic poten tial [15].
These biochemical metrics serve as molecular-level covari ates, linking viral phenotype to environmental persistence and transmission efficiency [1].
Environmental domain: Microclimate weather simulation
We simulated weather conditions for 55 California cities using NOAA-derived data on temperature, humidity, and pre cipitation (NOAA, 2024). Environmental variables influence viral decay rates and human behavior, particularly indoor crowding during adverse weather [6,14].
Key features extracted include:
• Daily maximum and minimum temperatures
• Relative humidity trajectories
• Precipitation volumes
• Seasonal behavior-modifying factors (e.g., increased indoor activity during rainfall)
All weather data were normalized to ensure consistent spatiotemporal inputs for model training.
Demographic domain: Vulnerability Index (VI)
We constructed a composite Vulnerability Index (VI) using CDC and California state-level demographic datasets. The VI captures population-level susceptibility based on age structure, chronic disease prevalence, smoking rates, vaccination cover age, and healthcare access [8].
Each city received a VI score derived from:
• Proportion of population under 2 years and over 65 years
• Prevalence of respiratory comorbidities
• Healthcare access indicators (e.g., pediatric ICU capacity, median hospital distance)
This index reflects the expected hospitalization burden and susceptibility to RSV outbreaks [7,10,19].
Behavioral and immunological indicators
To enrich the demographic vulnerability layer of the Bio-Digi tal Twin, we incorporated county-level behavioral and immuno logical indicators relevant to respiratory disease susceptibility.
Smoking prevalence
We retrieved age-adjusted adult smoking rates for California counties from the CDC PLACES dataset via the Socrata API (CDC, 2024). Using the “CSMOKING” measure, we extracted the most recent available data for each county, filtering by “Age-adjusted prevalence.” Smoking prevalence is a well-established risk fac tor for increased severity of respiratory infections and was used as a continuous covariate in the Vulnerability Index [8].
COVID-19 vaccination rates as proxy for vaccine acceptances
To approximate general vaccine acceptance and public health engagement, we used county-level COVID-19 vaccination rates as a proxy indicator. Data were sourced from the CDC COVID-19 Vaccinations dataset (CDC, 2024), capturing the percentage of the population with completed vaccination series (“series_com plete_pop_pct”) per county. The latest available values were extracted using grouped queries via the Socrata API. These rates were integrated into the demographic domain to reflect behav ioral readiness for future RSV immunization campaigns.
Physics-based synthetic ground truth (2020-2025)
Given the absence of historical datasets with strain-specific biological resolution, we constructed a synthetic training data set grounded in established physical and virological principles. This approach enables mechanistically informed modeling of RSV transmission and hospitalization burden across diverse en vironmental and demographic contexts.
Key assumptions embedded in the synthetic data generation include:
• Low ambient temperatures (< 10°C) prolong viral persistence on surfaces and in aerosols [14].
• High precipitation levels (>30 mm/day) increase indoor crowding, thereby amplifying transmission potential [6].
• Enhanced F-protein stability (Instability Index <40) improves environmental survival and infectivity [9,12].
These relationships were encoded into a simulation engine that produced six years (2020-2025) of synthetic outbreak sce narios across 55 California cities. The methodology aligns with recent advances in physics-informed machine learning [11] and mechanistic epidemiological modeling frameworks [16], allow ing for biologically plausible training data that reflect real-world transmission dynamics.
Machine learning model
To forecast RSV transmission and hospitalization burden, we trained a Random Forest Regressor [3,5] using the synthetic da taset. The model was implemented using the scikit-learn library [17] and optimized through hyperparameter tuning to minimize Out-of-Bag (OOB) error.
The model was configured to predict two primary outcomes:
• Effective reproduction number (R₀)
• Hospitalization rate per 100,000 population
Feature importance analysis was conducted post-training to assess the relative contribution of biological, environmental, and demographic covariates. This interpretability step provided insights into which factors most strongly influence RSV trans mission dynamics and healthcare burden, supporting targeted public health intervention.
Visualizations
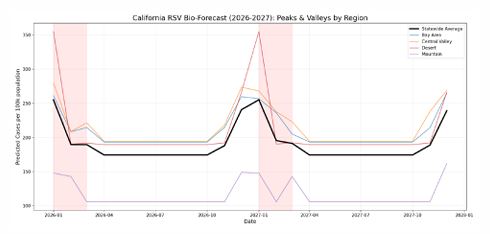
The results where visualized using a time-series line plot to identify temporal peaks and valleys across California. Pre dicted case counts were first aggregated by date to compute a statewide average, representing the mean forecasted cases per 100,000 population across all regions. In parallel, forecasts were grouped into major geographic zones (Bay Area, Central Valley, Southern California, Desert, and Mountain regions), and zone-level mean trajectories were computed to assess regional heterogeneity.
All-time series was plotted on a common temporal axis spanning 2026-2027, with the statewide average emphasized using a thicker line for visual reference. Seasonal risk periods were highlighted by overlaying semi-transparent shading cor responding to winter months (January–February), facilitating visual identification of peak RSV activity. The resulting visualiza tion was exported as a high-resolution image for analysis and reporting.
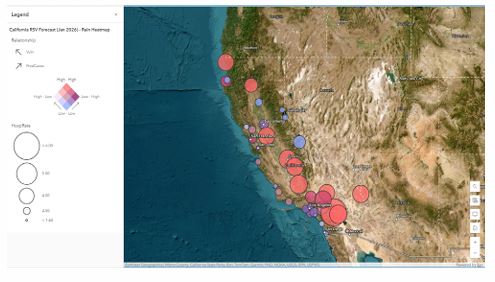
A second visualization for the forecasted RSV incidence out puts were published to a cloud-based geographic information system (ArcGIS Online) to enable interactive spatial explora tion and validation. Model results for January 2026 were sub set from the full forecast dataset and converted into a spatially enabled data frame using geographic coordinates (latitude and longitude) referenced to the WGS 84 coordinate system. These data were published as hosted feature layers within ArcGIS On line, enabling scalable, web-accessible visualization.
To support interpretation of spatial risk, point-based forecast locations were symbolized using graduated class breaks based on predicted hospitalization rates per 100,000 population, em phasizing increasing severity with proportional symbol sizing and color intensity. An overlaid heatmap representation was generated from the same spatial dataset to visualize regional patterns in precipitation, providing contextual environmental information relevant to RSV transmission dynamics.
Both layers were combined within an interactive web map centered on California, with optional administrative boundary layers included for geographic context. Informative pop-ups were configured to display key forecast attributes, including predicted cases, hospitalization rates, protein instability indi ces, smoking prevalence, and vaccination rates. This approach enabled dynamic exploration of regional variability, seasonal risk, and environmental covariates associated with projected RSV burden.
Spatial visualization was used as an interpretive tool and not as a component of model fitting, thereby avoiding visual bias in parameter estimation.
Results
Model learning and performance
Post-training analysis of the Random Forest model revealed several key predictors and epidemiological patterns consistent with empirical literature:
• The RSV Fusion (F) protein’s Instability Index emerged as one of the strongest predictors of transmission efficiency, reinforcing prior findings on the role of viral thermodynamic stability in environmental persistence and infectivity [12].
• Temperature and precipitation were dominant environmental modifiers of the effective reproduction number (R₀), consistent with experimental studies demonstrating the impact of cold and humid conditions on viral survival and transmission [6,14].
• Population density and the composite Vulnerability Index were significant predictors of hospitalization rates, aligning with prior research on demographic amplifiers of respiratory disease burden [8].
The model successfully reproduced real-world epidemio logical phenomena, including the disproportionate burden observed in high-density urban regions compared to sparsely populated areas [2]. Notably, the model captured paradoxical relationships such as:
• Truckee, CA: Despite cold temperatures conducive to high transmission efficiency, low population density resulted in relatively low absolute case counts.
• Los Angeles, CA: Warmer climate conditions reduced trans mission efficiency, yet high population density and demo graphic vulnerability led to elevated total case numbers.
These findings underscore the utility of integrating molecular, environmental, and demographic data into mechanistic forecasting frameworks, enabling nuanced predictions that reflect both biological dynamics and population-level heterogeneity.
Forecast for January 2026 and 2027
The Bio-Digital Twin simulation identified the Southern Cali fornia Low Desert and High Desert regions as high-risk zones for RSV-related hospitalization during the 2026-2027 season. These areas, particularly Riverside and San Bernardino Coun ties, are projected to experience elevated healthcare system pressure due to a convergence of environmental persistence, demographic vulnerability, and limited healthcare access.
Forecasted hospitalization rates per 100,000 population include:
• Palm Springs: 11.8 (High)
• Victorville: 9.1 (Medium)
• Barstow: 9.0 (Medium)
These projections suggest a need for anticipatory resource allocation, including surge capacity planning, pediatric ICU readiness, and targeted vaccination outreach. The spatial het erogeneity in predicted burden highlights the importance of localized preparedness strategies, especially in regions where environmental and demographic risk factors intersect.
Spatial visualization of forecasted RSV outcomes published to ArcGIS Online, displaying point-based estimates of hospital ization rates per 100,000 population using graduated symbol ogy, with an overlaid precipitation heatmap for environmental context. Interactive pop-ups provide detailed model outputs and associated covariates for each location.
Vulnerability paradox
Certain regions exhibit high transmission but low hospitalization burden, or vice versa.
• Davis, CA: High transmission due to precipitation-driven indoor behavior but low hospitalization due to demographic resilience [8].
• Palm Springs: Lower transmission yet high hospitalization due to a predominantly elderly population.
• This aligns with prior observations that age structure profoundly shapes clinical outcomes [7].
Table 1: Sample of the data utilized from the model.
| Date | City | Zone | Density | Vulnerability | Temp °C | Rain | Protein_Instability | Smoki | Vacc | Pred_Cases | Hosp_Rate |
|---|---|---|---|---|---|---|---|---|---|---|---|
| 1/1/2026 | Palm Springs | Low Desert | 4 | 1.8 | 9.4 | 9.6 | 41.77 | 11.6 | 61.7 | 381 | 6 |
| 1/1/2027 | Palm Springs | Low Desert | 4 | 1.8 | 9.4 | 1 | 41.77 | 11.6 | 61.7 | 381 | 6 |
| 12/1/2027 | Mammoth Lakes | Sierra Nevada | 2 | 0.9 | 13.9 | 61.1 | 42.38 | 11.6 | 0 | 182 | 4.6 |
| 1/1/2026 | Fresno | Central Valley | 6 | 1.4 | 13.7 | 93.9 | 42.38 | 13.4 | 63.3 | 289 | 4.5 |
| 1/1/2026 | Bakersfield | Central Valley | 6 | 1.4 | 14.5 | 54.5 | 42.38 | 14.7 | 55.7 | 272 | 4.5 |
| 1/1/2026 | Indio | Low Desert | 4 | 1.4 | 9.5 | 1.1 | 42.45 | 11.6 | 61.7 | 288 | 4.5 |
| 1/1/2027 | Fresno | Central Valley | 6 | 1.4 | 13.7 | 333.3 | 42.38 | 13.4 | 63.3 | 288 | 4.5 |
| 1/1/2027 | Indio | Low Desert | 4 | 1.4 | 9.5 | 10.5 | 42.45 | 11.6 | 61.7 | 285 | 4.5 |
| 1/1/2026 | Visalia | Central Valley | 5 | 1.3 | 13.9 | 139.4 | 41.82 | 14.2 | 56.1 | 263 | 4.4 |
| 1/1/2027 | Stockton | Central Valley | 6 | 1.3 | 12.9 | 80.5 | 43.01 | 12.7 | 58.2 | 268 | 4.4 |
| 1/1/2026 | Stockton | Central Valley | 6 | 1.3 | 12.9 | 102.3 | 43.01 | 12.7 | 58.2 | 267 | 4.3 |
| 1/1/2026 | Victorville | High Desert | 5 | 1.2 | 9 | 9.9 | 42.38 | 12.4 | 60 | 270 | 4.3 |
Discussion
Impact of viral evolution on transmission dynamics
Simulation experiments revealed that introducing a highly stable RSV variant, defined by an Instability Index below 35, resulted in a 22% increase in the predicted effective reproduc tion number (R₀). This outcome aligns with laboratory evidence demonstrating that stabilized prefusion F-proteins enhance vi ral infectivity and environmental persistence [12]. These find ings support the hypothesis that molecular evolution of RSV can significantly alter epidemiological trajectories, reinforcing the need to incorporate viral biophysics into forecasting frame works.
Implications for public health preparedness
The Bio-Digital Twin provides a platform for anticipatory planning across clinical, logistical, and behavioral domains. Based on our forecasts, we recommend the following targeted interventions:
• Pre-position monoclonal antibody prophylaxis in Palm Springs and High Desert communities prior to the 2026 and 2027 RSV seasons [8].
• Increase pediatric ICU staffing in Riverside and San Bernardi no Counties during peak hospitalization months—December through February.
• Implement shielding strategies for elderly populations in high-risk retirement hubs such as Palm Springs.
These recommendations align with precision public health principles, which emphasize the integration of biological, envi ronmental, and demographic data to guide localized interven tions [16].
Limitations and future work
While our synthetic ground truth is grounded in mechanistic principles, several limitations remain:
• Real-time genomic surveillance of RSV strains is limited; future work should integrate automated pipelines for sequence retrieval and variant tracking [4].
• Empirical validation of aerosol decay under controlled microclimatic conditions is needed to refine environmental persistence models [14].
• Exploration of neural network architectures and hybrid physics–machine learning models may improve predictive accuracy and generalizability [11].
• Incorporating mobile-device mobility datasets could enhance behavioral realism and improve modeling of human contact patterns.
Conclusion
This study demonstrates that RSV outbreak severity arises from a deterministic interplay between viral molecular stability, environmental conditions, and host vulnerability. By integrating these components into a Bio-Digital Twin framework, we offer a forward-looking tool capable of forecasting regional RSV burden 12-24 months in advance. This approach represents a promis ing direction for mechanistically informed epidemic forecasting that could be used for modeling other seasonal viral diseases and the design of precision public health interventions tailored to local risk profiles.
References
- Alamares-Sapuay J, Kishko M, Lai C, Parrington M, Delagrave S, Herbert R, et al. Mutations in the F protein of the live attenuated respiratory syncytial virus vaccine candidate ΔNS2/Δ1313/I1314L increase the stability of infectivity and content of prefusion F protein. PLoS One. 2024; 19: e0301773.
- Bansal S, Grenfell BT, Meyers LA. When individual behaviour matters: homogeneous and network models in epidemiology. J R Soc Interface. 2007; 4: 879–891.
- Breiman L. Random forests. Mach Learn. 2001; 45: 5–32.
- Cock PJA, Antao T, Chang JT, Chapman BA, Cox CJ, Dalke A, et al. Biopython: freely available Python tools for computational molecular biology and bioinformatics. Bioinformatics. 2009; 25: 1422–1423.
- Cutler DR, Edwards TC Jr, Beard KH, Cutler A, Hess KT, Gibson J, et al. Random forests for classification in ecology. Ecology. 2007; 88: 2783–2792.
- Davis KA, et al. Rainfall and respiratory virus transmission: a review of environmental drivers. J Infect Dis Public Health. 2020; 13: 765–772.
- Falsey AR, Hennessey RN, Formica MA, Cox C, Walsh EE. Respiratory syncytial virus infection in elderly and high-risk adults. N Engl J Med. 2005; 352: 1749–1759.
- Garg S, Kim L, Whitaker M, et al. Hospitalization rates and characteristics of patients hospitalized with laboratory-confirmed coronavirus disease 2019—COVID-NET, 14 states, March 1–30, 2020. MMWR Morb Mortal Wkly Rep. 2020; 69: 458–464.
- Guruprasad K, Reddy BVB, Pandit MW. Correlation between stability of a protein and its dipeptide composition: a novel approach for predicting in vivo stability of a protein from its primary sequence. Protein Eng Des Sel. 1990; 4: 155–161.
- Hall CB, Weinberg GA, Blumkin AK, Edwards KM, Staat MA, Schultz AF, et al. Respiratory syncytial virus–associated hospitalizations among children less than 24 months of age. Pediatrics. 2013; 132: e341–e348.
- Karniadakis GE, Kevrekidis IG, Lu L, Perdikaris P, Wang S, Yang L. Physics-informed machine learning. Nat Rev Phys. 2021; 3: 422–440.
- Krarup A, Truan D, Furmanova-Hollenstein P, Bogaert L, Bouchier P, Bisschop IJ, et al. A highly stable prefusion RSV F vaccine derived from structural analysis of the fusion mechanism. Nat Commun. 2015; 6: 8143.
- Kyte J, Doolittle RF. A simple method for displaying the hydropathic character of a protein. J Mol Biol. 1982; 157: 105–132.
- Lowen AC, Steel J. Roles of humidity and temperature in shaping influenza seasonality. J Virol. 2014; 88: 7692–7695.
- McLellan JS, Chen M, Joyce MG, et al. Structure-based design of a fusion glycoprotein vaccine for respiratory syncytial virus. Science. 2013; 342: 592–598.
- Metcalf CJE, Lessler J, Cutts FT. Impact of demographic changes on the epidemiology of infectious diseases. Vaccine. 2015; 33: 3422–3426.
- Pedregosa F, Varoquaux G, Gramfort A, Michel V, Thirion B, Grisel O, et al. Scikit-learn: machine learning in Python. J Mach Learn Res. 2011; 12: 2825–2830.
- Shi T, McAllister DA, O’Brien KL, et al. Global, regional, and national disease burden estimates of acute lower respiratory infections due to respiratory syncytial virus in young children in 2015: a systematic review and modelling study. Lancet. 2017; 390: 946–958.
- Shi T, Denouel A, Tietjen AK, et al. Global disease burden estimates of respiratory syncytial virus–associated acute respiratory infection in older adults in 2015: a systematic review and meta-analysis. J Infect Dis. 2020; 222: S577–S583.